
Procedural generation is getting broader and deeper in games every passing month. While more and more genres are finding ways to generate parts of their play space, familiar faces are finding innovative applications for generative techniques – from universe-scale vastness to the intricate details of a single lost culture. In the midst of this rapid growth, we desperately need new and better ways to talk and think about generative design. This week on the Saturday Papers I want to show you one particular paper with an idea that’s really resonated with me lately, but that’s simple enough to use in games of all shapes and sizes, right now. Let’s jump in!
We’re reading Analyzing the Expressive Range of a Level Generator by Gillian Smith and Jim Whitehead, who at the time were both working at UC Santa Cruz (Gillian has since moved to Northeastern University in Boston). The paper is partly about Launchpad, a system for designing platformer levels using a rhythm-based approach, but the main thrust of the paper is how Smith and Whitehead analysed Launchpad’s level generation by looking at what it produced, in what quantities, and what qualities they had. They call this the expressive range of a generator.
Generative software/proc gen devs: do you primarily test your work by changing parameters + looking at output? RT=<3
— mi̶kÍ e Íco̴̧͞ok (@mtrc) February 16, 2016
Typically, game developers evaluate procedural generators by pressing the big red ‘generate’ button and looking at the output. Maybe they press it ten times, maybe a hundred times, but the basic principle is the same: by looking at the output of your generator, you get a feel for what it can produce. This actually relies on the exact same human instinct that leads us to get bored of procedural generators, because once the player gets that same feel for what the generator is doing, it can often spell the end of their interest in the system.

There are two big problems with this approach. The first is that it’s kind of boring and more than a little shallow. We can see what the generator is doing now, but it doesn’t really help us appreciate what it might be capable of doing with a bit of tweaking. This is particularly true for commonplace PCG, where algorithms are repeated and passed along by hundreds of game developers in a kind of code version of the gossip game. Developers often end up using algorithms without knowing what the algorithm might be able to do with a bit of tweaking. The second problem is that it works for some generators better than others. If your generator is pretty consistent then clicking generate a few times is great, you get a good approximation of what it can produce. If your generator is incredibly unpredictable, though, then clicking generate a dozen times might show you a very biased perspective of what it can. What if all of the content you see are actually very atypical? What does typical even look like for your generator?
So, this is where expressive range comes in. The idea behind this is that instead of looking at a few outputs ourself and judging by eye, we write down interesting features to measure in our content (like how long the level is, or what DPS the monsters dish out)Â and then automatically run thousands of tests to gather these measurements. So let’s say we’re generating levels for Invisible Inc. and we want to measure two things: the average distance from the start to the objective, and the average distance from the objective to the finish. Both are quite easy to calculate, so a computer can do it no problem. We run our generator a thousand times, and each time it generates a level we calculate those two distances and note them down. When we’re done, we make a histogram that looks a bit like this:
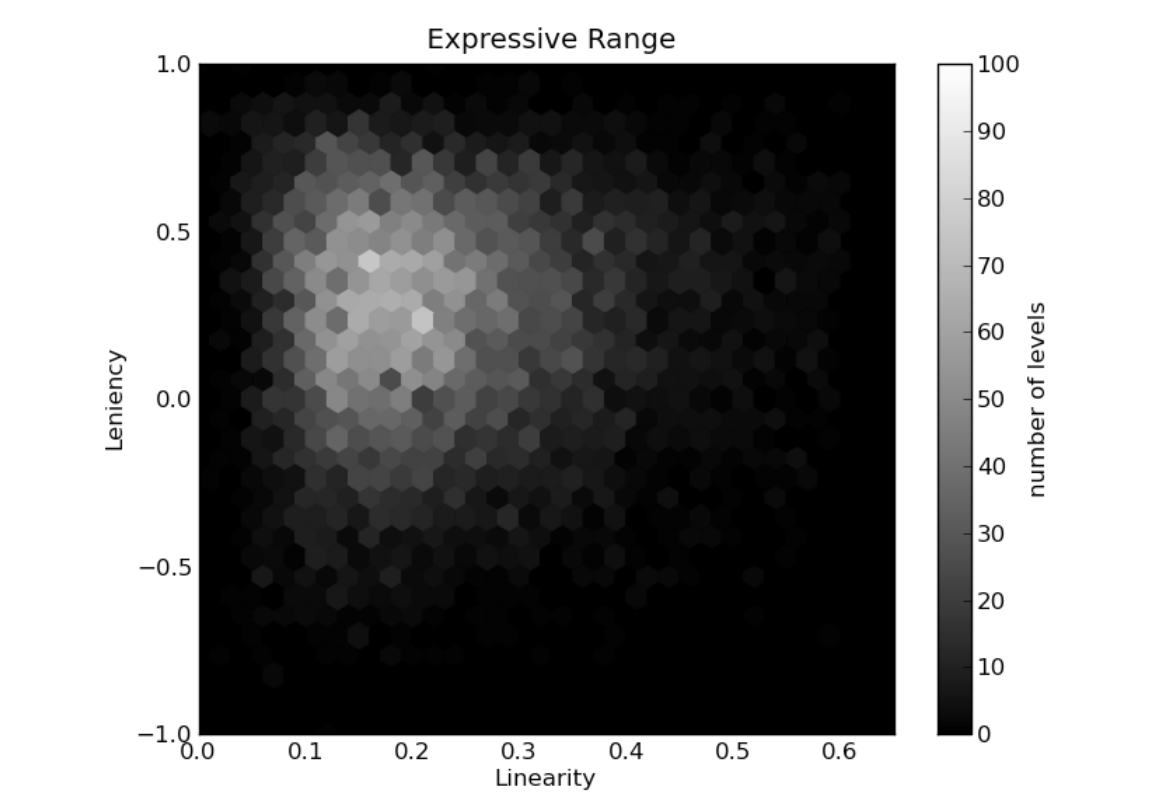 This is taken directly from the paper rather than measuring Invisible Inc. (I wish!) Smith and Whitehead are measuring linearity and leniency here, two metrics they defined a bit like our two distance measurements (we won’t worry precisely what they mean here). For each point on the histogram, we colour it in a lighter colour the more levels we saw with those values. You can see in the above histogram that the light colours peak around 0.2 linearity (the x-axis) and 0.25 leniency (the y-axis).
This made a nice picture – but how does it actually help us? First and foremost, simply knowing where the average lies helps us a lot. If we think our generator produces maps with roughly even distances between start, objective and exit, then the expressive range can either prove or disprove that. It also helps reveal whether this average is representative or not. In the above histogram you can see that the linearity ranges from 0.1 all the way up to 0.5. It’s really important that the game designer can see this range, because even if an extreme case only happens 1% of the time, it’s important to recognise what those extreme cases look like. Every generator has its edge cases – the only difference is whether you’ve already seen yours before you give your game to someone.
Expressive range does more than just show us what our generator is doing now, though. Because it provides such a clear visualisation of the generator, it also makes it really easy to compare changes in the generator. By creating expressive range histograms before and after changing a parameter, we can more clearly see the impact it has on what the generator does. Look at these three histograms from the paper, generated after different changes to Launchpad:
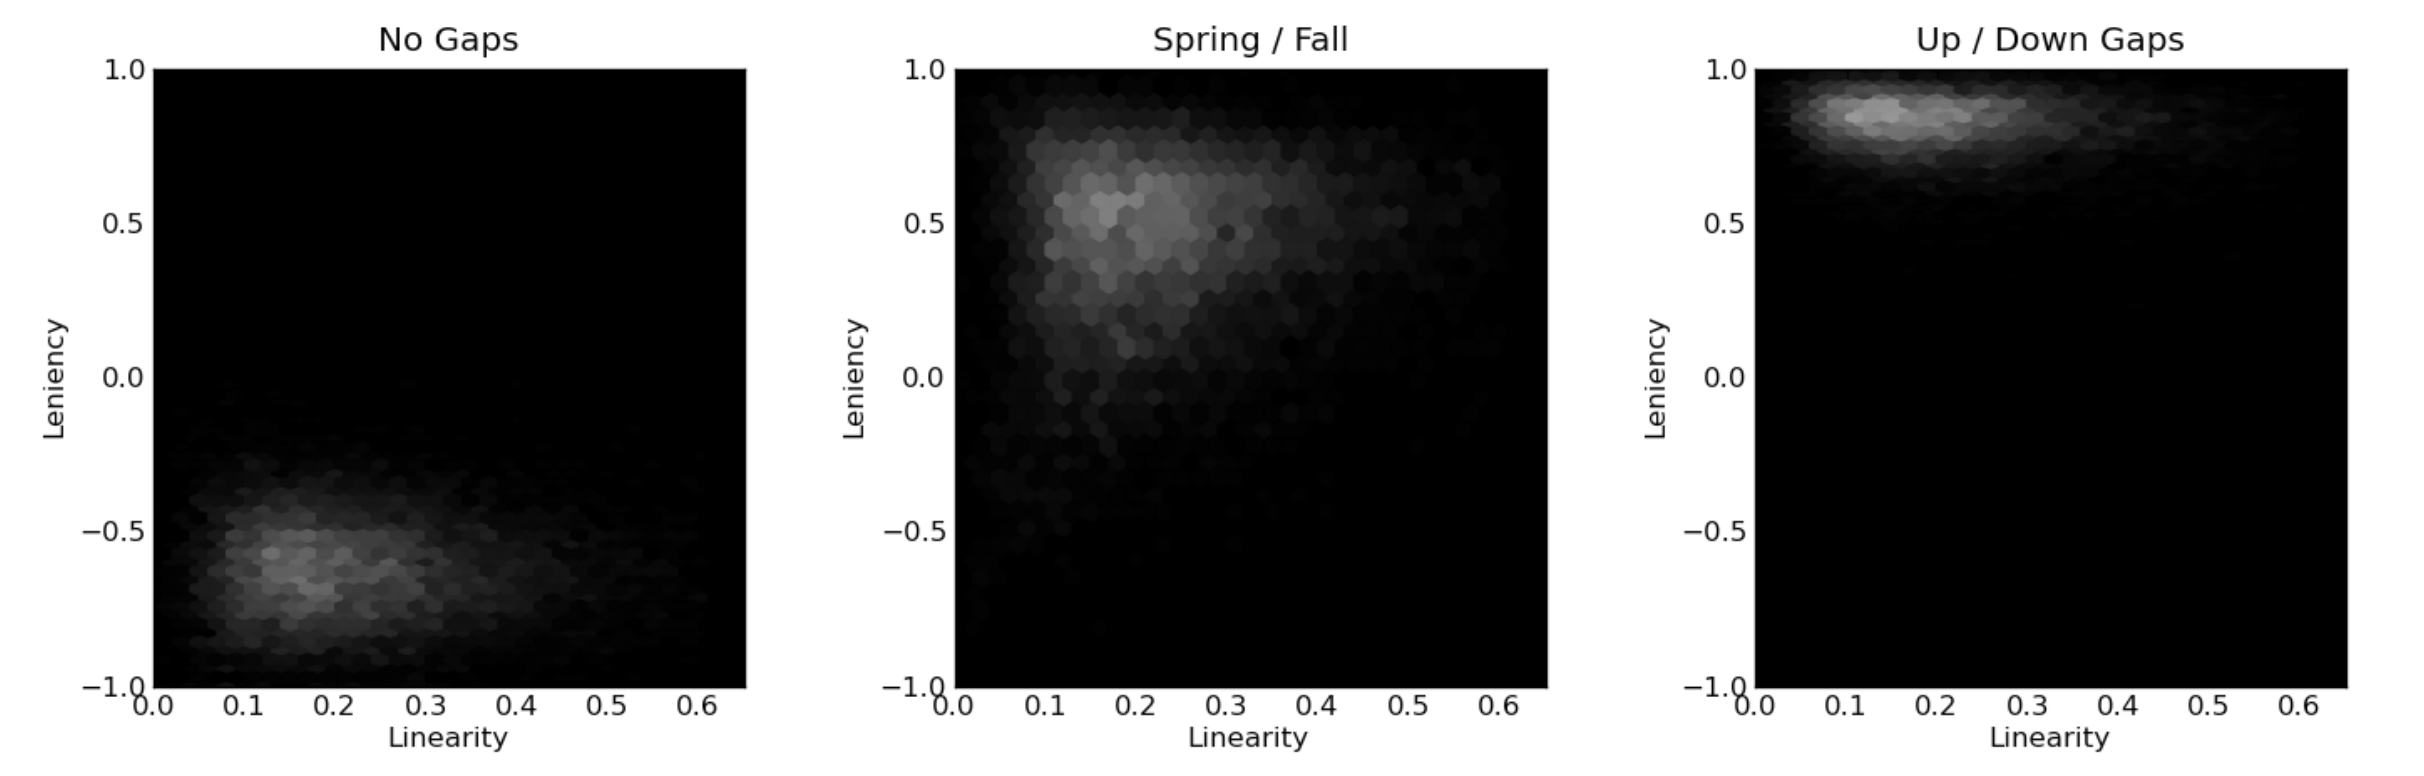
By changing weights within their generator, Smith and Whitehead show huge changes in the resulting histograms. It’s easy to see not only that a change has occurred, and not only that the change is big, but also the kind of change it is – what metrics is it altering? What dimensions are affected? How variable is the generator now? If you’re interested in more on this problem of how to visualise the outcome of these analyses, this journal paper extends the ideas and looks at some innovative ways to explore the results.
When I talked to Jim and Gillian about this piece, they mentioned that there’s been some development along these lines since then. In particular, a couple of papers (here’s one by Alessandro Canossa and Gillian, and another by Julian Mariño, Willian Reis and Levi Lelis) tackle the problem of finding good metrics for evaluating generated content. We might come back to these papers in future episodes, as they tackle a different but related problem to that of expressive range. Finding good metrics to measure in a piece of content is difficult, and takes a lot of knowledge about what you’re generating, in order to know what to look for.
I think expressive range is an incredibly powerful idea, and I hope to see more developers using it in future. It does require some extra effort and knowledge – and choosing good metrics to measure in your content can be hard. But the results are powerful and elegant, and they help reduce the dark art aspects of procedural generation (assuming you want them removed, of course!). Procedural generation badly needs new technology and ideas to help people advance the state of the art and open it up to new kinds of user, and I think expressive range is one step in the right direction.
Where To Find More
Gillian Smith is now an assistant professor at Northeastern University in Boston, where she bridges the gap between the schools of Computer Science and Art and Design. Jim Whitehead is Professor of Computational Media at UC Santa Cruz, where he supervised Gillian’s PhD. Both are just lovely folks, and still have plenty of interest in these topics – you should get in touch with them!
Thanks for reading, and welcome back to another Saturday Papers. 2016 is jam-packed for me right now, but I promise to keep putting these out whenever I can. Enjoy the weekend and happy Persian new year to anyone celebrating it tomorrow!
I’m a big fan of this technique – I did something similar to generate levels for “Not the Robots,” but instead of graphing the analysis, it was only used at generation time (so for each quality-sensitive part of the generator, it makes a bunch of examples of how it might do things, evaluates them all with some case-specific fitness function, then discards everything except for the best one and presents the winner as The Content). This helped a ton because the game is based on random levels and stealth gameplay, which is a recipe for unhappy-accidents…but with proper fitness functions, a ton of potentially unfair layouts can be avoided.
It’s also handy for removing edge cases – let’s look at a horrible situation where half of the levels being generated are compelling, and the other half are almost entirely walls, but you can’t fix that problem by editing the generator directly or else you’ll lose some particularly compelling features from the levels that do happen to work correctly. In this situation, you can generate 20 examples at load time and search for that flaw specifically. In the average case we’re considering, you have half “viable” layouts and half “broken” layouts – but you’re only using one out of each set of twenty, so as long as you have at least one viable layout in there (and as long as the fitness function never favors a broken layout over a viable one), you’re all good. The chance of NOT rolling a viable layout in a set of twenty attempts is (1/2)^20 in this case – so the chance of the player encountering a broken layout in a fitness-tested level has been reduced from 1/2 to ~1/100,000. Big win, small effort!
I find this method is very freeing in terms of generation possibilities – it’s “safer” to use stranger and more chaotic rules when you have a safety buffer to check over the results and make sure they’re not getting too rowdy.
I also have a sense that this process is a reasonable approximation of one of the steps in a person’s creative process – it’s like the “spitballing” phase